Abstract
It is commonly thought that human genetic diversity in non-African populations was shaped primarily by an out-of-Africa dispersal 50-100 thousand yr ago (kya). Here, we present a study of 456 geographically diverse high-coverage Y chromosome sequences, including 299 newly reported samples. Applying ancient DNA calibration, we date the Y-chromosomal most recent common ancestor (MRCA) in Africa at 254 (95% CI 192-307) kya and detect a cluster of major non-African founder haplogroups in a narrow time interval at 47-52 kya, consistent with a rapid initial colonization model of Eurasia and Oceania after the out-of-Africa bottleneck. In contrast to demographic reconstructions based on mtDNA, we infer a second strong bottleneck in Y-chromosome lineages dating to the last 10 ky. We hypothesize that this bottleneck is caused by cultural changes affecting variance of reproductive success among males.
Despite the higher per-base-mutation rate of mtDNA, the much greater length of the Y chromosome (Chr Y) offers the highest genealogical resolution of all non-recombining loci in the human genome. Previous studies have established a standard Y chromosome haplogroup nomenclature based on resequencing of limited tracts of the locus in small numbers of geographically diverse samples ( The Y Chromosome Consortium 2002; Karafet et al. 2008; van Oven et al. 2013). As a result, the precise order and timing of the phylogenetic splits has only recently started to emerge from whole Y chromosome sequences ( Francalacci et al. 2013; Mendez et al. 2013; Poznik et al. 2013; Wei et al. 2013; Lippold et al. 2014; Scozzari et al. 2014; Yan et al. 2014; Hallast et al. 2015). While the male to female effective population size ratio has been estimated as being below one throughout much of human evolutionary history ( Lippold et al. 2014), the factors affecting its dynamics are still poorly understood. Here, we combine 299 new whole Y chromosome high-coverage sequences from 110 populations with similar publicly available data ( Fig. 1; Supplemental Table S1; Methods). We use these 456 sequences to estimate the coalescent times and order of haplogroup splits (Supplemental Information 3,4), and we use simulations (Supplemental Information 5) to test the scenarios that can explain the observed patterns in the mtDNA and Y chromosome data for a subset of 320 individuals.
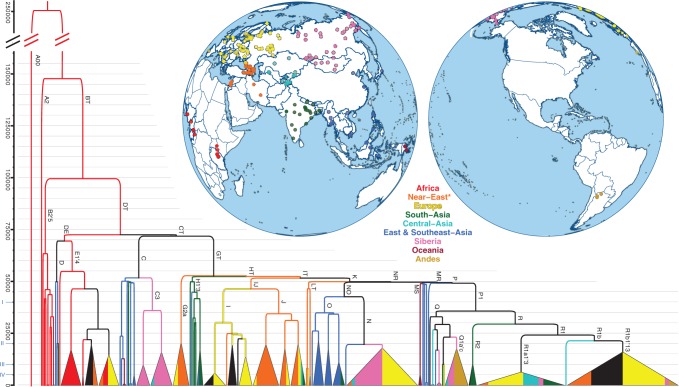
The phylogenetic tree of 456 whole Y chromosome sequences and a map of sampling locations. The phylogenetic tree is reconstructed using BEAST. Clades coalescing within 10% of the overall depth of the tree have been collapsed. Only main haplogroup labels are shown (details are provided in Supplemental Information 6). Colors indicate geographic origin of samples (Supplemental Table S1), and fill proportions of the collapsed clades represent the proportion of samples from a given region. Asterisk (*) marks the inclusion of samples from Caucasus area. Personal Genomes Project ( personalgenomes.org) samples of unknown and mixed geographic/ethnic origin are shown in black. The proposed structure of Y chromosome haplogroup naming (Supplemental Table S5) is given in Roman numbers on the y-axis.
In labeling Y chromosome haplogroups, we follow the principles and rules set out by the Y Chromosome Consortium (YCC) ( The Y Chromosome Consortium 2002). As we introduce a large number of new whole Chr Y sequences that substantially increase the resolution of the internal branches of the Chr Y tree, we try to both incorporate the new information and to maintain the integrity and historical coherence of the initial YCC haplogroup nomenclature as introduced in 2002 and its updates ( Jobling and Tyler-Smith 2003; Karafet et al. 2008). We use an approach similar to the concise reference phylogeny proposed by van Oven et al. (2014) with minor modifications that are aimed to make the haplogroup nomenclature more amenable to the incorporation of novel haplotypes than it is now (Supplemental Information 6).
Results
Using standard and custom filters (Supplemental Information 2; Supplemental Table S2), we first identified reliable regions on the Chr Y and retained 8.8 Mb of sequence per individual. A total of 35,700 SNPs had a call rate higher than 95% and were subsequently used in phylogenetic analyses and for estimation of coalescence times. Data quality assessment by evaluating SNP differences between father-son pairs resulted in an average of approximately one mutation per pair, indicating a low false-positive rate, and only 588 recurrent sites (1.6%) observed in the filtered data. Combining independent evidence from two ancient DNA sequences, we estimated the mutation rate of Y chromosome binary SNPs in the filtered regions at 0.74 × 10⁻⁹ (95% CI 0.63-0.95 × 10⁻⁹) per base pair (bp) per yr (Supplemental Information 3). It should be noted that this estimate is based on only two ancient DNA samples from a relatively recent time horizon and the same Y chromosome haplogroup. However, a very similar mutation rate estimate of 0.76 × 10⁻⁹ per bp per yr was determined independently from a different ancient DNA specimen of much older age by a recent study ( Fu et al. 2014).
We uncovered new phylogenetic structure and reappraised haplogroup definitions and their branch lengths in the global phylogeny ( Fig. 1; Supplemental Fig. S3). We also generated two Illumina high-coverage sequences of African haplogroup A00 ( Mendez et al. 2013) to root the phylogeny and to determine the ancestral versus derived states of the variable sites (Supplemental Table S8). We estimated the age of the split between A00 and the rest at 254 thousand yr ago (kya) (95% CI 192-307 kya; Supplemental Table S7). Comparing chimpanzee and A00 outgroup information across the 652 positions separating haplogroups A2′5 and BT (Supplemental Fig. S13) revealed inconsistency at 4.6% sites. The observed number of discordant calls was significantly higher than the 1%-2% discordance rate predicted from phylogenetic divergence between human and chimpanzee genomes ( The Chimpanzee Sequencing and Analysis Consortium 2005) and likely reflects the uncertainties in mapping cross-species reads to the same reference sequence.
In anticipation of ever larger numbers of whole sequences, we simplified the Y chromosome haplogroup nomenclature (Supplemental Information 6) for all clades by using the "join" rule ( The Y Chromosome Consortium 2002) and classified them relative to four coalescent horizons ( Fig. 1; Supplemental Table S5). We used high-coverage whole-genome sequence data from this and previous studies to define the layout of the basic A and B subclades (Supplemental Figs. S14, S15). We found 236 markers that separate haplogroups restricted to African populations (A and B) from the rest of the phylogeny (Supplemental Fig. S13). Notably, we detected a >15-ky gap between the separation of African and non-African lineages at 68-72 (95% CI 52-87) kya and the short interval at 47-52 (95% CI 36-62) kya when non-African lineages differentiate into higher level haplogroups common in Eurasian, American, and Oceanian populations (Supplemental Table S7; Supplemental Fig. S9). This gap would be even more pronounced (52-121 kya) if extant Asian D and African E distributions could be explained by an early back-migration of ancestral DE lineages to Africa ( Hammer et al. 1998).
In the non-African haplogroups C and F, we identified a number of novel features. We report that C now bifurcates into C3 (Supplemental Fig. S20) and another clade containing all the other C lineages including two new highly divergent subclades detected in our Island Southeast Asian samples that we call C7 and C9 (Supplemental Fig. S21). We show that only the F1329 SNP (Supplemental Fig. S13) first separates the deep F and GT branches and corroborate the succeeding swift split of G from HT by the single M578 SNP ( Poznik et al. 2013). Similarly, all other subsequent inner branches (IT, K, NR, MR, P), common throughout non-African populations, are short and consistent with a rapid diversification of the basic Eurasian and Oceanian founder lineages at around 50 kya (Supplemental Fig. S9; Bowler et al. 2003; Higham et al. 2014). Within the Y chromosome haplogroups common in Eurasian populations, we noticed that many coalesce within the last 15 ky ( Fig. 1), i.e., corresponding to climate improvement after the Last Glacial Maximum, and a cluster (Supplemental Table S7; Supplemental Fig. S11) of novel region-specific clades (Supplemental Information 6) with coalescence times within the last 4-8 ky. Regional representations of pairwise divergence times of Y chromosomes also revealed clustering of coalescence events consistent with the peopling of the Americas at around 15 kya (Supplemental Fig. S12).
We used Bayesian skyline plots (BSP) to infer temporal changes of regional male and female effective population sizes (Ne) (Supplemental Fig. S4A). The cumulative global BSP of 320 Y chromosomes with known geographic affiliation and the plot inferred from mtDNA sequences from the same individuals both showed increases in the Ne at ∼40-60 kya ( Fig. 2). However, the two plots differed in a number of important features. Firstly, the Ne estimates based on mtDNA are consistently more than twice as high as those based on the Y chromosome (Supplemental Fig. S6). Secondly, both mtDNA and Y plots (Supplemental Fig. S4) showed an increase of Ne in the Holocene, which has been documented before for the female Ne ( Gignoux et al. 2011). However, the Y chromosome plot suggested a reduction at around 8-4 kya (Supplemental Fig. S4B; Supplemental Table S4) when the female Ne is up to 17-fold higher than the male Ne (Supplemental Fig. S5).
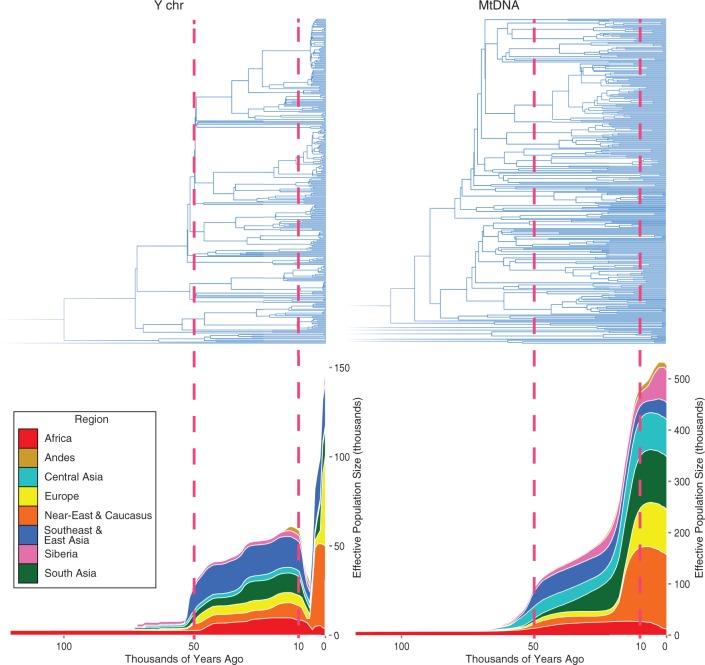
Cumulative Bayesian skyline plots of Y chromosome and mtDNA diversity by world regions. The red dashed lines highlight the horizons of 10 kya and 50 kya. Individual plots for each region are presented in Supplemental Figure S4A.
Discussion
The estimated time line of the Y chromosome coalescent events in non-African populations (Supplemental Fig. S9) fits well with archaeological evidence for the dates of colonization of Eurasia and Australia by anatomically modern humans as a single wave ∼50 kya ( Bowler et al. 2003; Mellars et al. 2013; Higham et al. 2014; Lippold et al. 2014). However, considering the fact that the Y chromosome is essentially a single genetic locus with an extremely low Ne, estimated <100 at the time of the out-of-Africa dispersal ( Lippold et al. 2014), these results cannot refute the alternative models suggesting earlier Middle Pleistocene dispersals (100-130 kya) from Africa along the southern route ( Armitage et al. 2011; Reyes-Centeno et al. 2014). The evidence for these early dispersals could potentially be embedded only in the autosomal genome.
The surprisingly low estimates of the male Ne might be explained either by natural selection affecting the Y chromosome or by culturally driven sex-specific changes in variance in offspring number. As the drop of male to female Ne does not seem to be limited to a single or a few haplotypes (Supplemental Fig. S3), selection is not a likely explanation. However, the drop of the male Ne during the mid-Holocene corresponds to a change in the archaeological record characterized by the spread of Neolithic cultures, demographic changes, as well as shifts in social behavior ( Barker 2006). The temporal sequence of the male Ne decline patterns among continental regions (Supplemental Fig. S4B) is consistent with the archaeological evidence for the earlier spread of farming in the Near East, East Asia, and South Asia than in Europe ( Fuller 2003; Bellwood 2005). A change in social structures that increased male variance in offspring number may explain the results, especially if male reproductive success was at least partially culturally inherited ( Heyer et al. 2005).
Changes in population structure can also drastically affect the Ne. In simple models of population structure, with no competition among demes, structure will always increase the Ne. However, structure combined with an unbalanced sampling strategy can lead BSP to infer false signals of population decline under a constant population size model ( Heller et al. 2013). An increase in male migration rate might reduce the male Ne but is unlikely to cause a brief drastic reduction in Ne as observed in our empirical data. Similarly, simple models of increased or decreased population structure are not sufficient to explain the observed patterns (Supplemental Information 5; Supplemental Fig. S7). However, in models with competition among demes, an increased level of variance in expected offspring number among demes can drastically decrease the Ne ( Whitlock and Barton 1997). The effect may be male-specific, for example, if competition is through a male-driven conquest. A historical example might be the Mongol expansions ( Zerjal et al. 2003). Innovations in transportation technology (e.g., the invention of the wheel, horse and camel domestication, and open water sailing) might have contributed to this pattern. Likely, the effect we observe is due to a combination of culturally driven increased male variance in offspring number within demes and an increased male-specific variance among demes, perhaps enhanced by increased sex-biased migration patterns ( Destro-Bisol et al. 2004; Skoglund et al. 2014) and male-specific cultural inheritance of fitness.
We note that any nonselective explanation for the reduction in Ne would also predict a reduction of the Ne at autosomal loci in this short time interval (Supplemental Fig. S6). In fact, when the sex difference in Ne is large, the autosomal effective population size should be dominated by the sex with the lowest effective population size. However, most existing methods are underpowered to detect Ne changes within the past few thousand years (i.e., relatively short-lived demographic events) from recombining genome-wide sequence data, resulting in limited evidence either for or against such patterns in autosomal data. A recent study using a newly developed approach reported variable growth patterns in the window of 2-10 ky among global populations and some evidence of a reduction in the Ne in local populations ( Schiffels and Durbin 2014). Finally, the inferred mid-Holocene Ne dips may represent a genuine population collapse following the introduction of farming, as has been recently shown for Western Europe using summed radiocarbon date density through time ( Shennan et al. 2013).
The male-specific effective population size changes reported here highlight the potential of whole Y chromosome sequencing to improve our understanding of the demographic history of populations. Further insights into the causes of such sex-specific patterns will benefit from population-scale Y chromosome data from ancient DNA studies and their interpretation in an interdisciplinary framework including also archaeological and paleoclimatic evidence and integrative spatially explicit simulations.
Methods
Samples and sequencing
Following informed consent donor permission and authorization by local ethics committees, saliva or blood samples were collected from 299 unrelated male individuals from 110 populations, of which 16 are released under the accession number PRJEB7258 ( Fig. 1; Supplemental Table S1; Clemente et al. 2014). For quality checks, we used additional data from 10 Estonian first-degree relatives, 24 Dutch father-son pairs, and four duplicate samples. Sequencing of the whole genome was performed at Complete Genomics (Mountain View, California) at standard (>40×) coverage for blood- and high coverage (>80×) for saliva-based DNA samples; the Dutch father-son pairs were blood samples sequenced at >80× coverage. Y chromosome (Chr Y) data from X-degenerate nonrecombining regions was extracted using cgatools and analyzed in combination with publicly available data ( Drmanac et al. 2010; Lachance et al. 2012) and the Personal Genomes Project.
Independently, for the purpose of rooting the Chr Y tree with the oldest known clade, we sequenced the whole genomes from the buccal swabs of two individuals from the Mbo population, with the prior knowledge of their haplogroup being A00. This information was based on STR profiles and SNP genotyping ( Mendez et al. 2013). Sequencing was performed on the Illumina HiSeq 2000 machines at the Genomic Research Center, Gene by Gene, Houston, Texas, at 30× aimed coverage. We used BWA 0.5.9 ( Li and Durbin 2009) to map the paired-end reads to the GRCh37 human reference sequence, removing PCR duplicates with SAMtools 0.1.19 rmdup command ( Li et al. 2009), and then calling Chr Y genotypes with SAMtools mpileup and BCFtools ( Li et al. 2009), resulting in the average coverage for Chr Y of the two individuals 12.7× and 17.2×, respectively.
Filtering the sequence data
We filtered the variant sites by the quality scores provided by Complete Genomics and kept only high-quality biallelic SNPs. We developed several additional filters to improve the quality of the resulting data set. Altogether, we tested four filters (Supplemental Table S2): (1) >5× unique sequence coverage filter, where regions with <5× unique coverage on Chr Y were removed; (2) X chromosome normalized coverage filter, where we tracked the fluctuations of relative unique coverage (UC) normalized to that of the X chromosome (Chr X) to highlight the deviation of local sequence coverage from the expected mean; (3) regional exclusion mask, where we exclude all of Chr Y outside 10.8-Mb sequence mostly overlapping with X-degenerate regions shown to yield reliable next generation sequencing (NGS) data; and (4) re-mapping filter, where we modeled poorly mapping regions on Chr Y and identified those that also map to sequence data derived from female individuals (Supplemental Table S2; Supplemental Information 2).
Y chromosome mutation rate and haplogroup age estimation
In order to minimize the effects of NGS differences and autosomal versus sex chromosome specifics on mutation rate calibration, and to avoid the need to make assumptions about the extent of genetic variation in relation to archaeological evidence, we calibrated the Chr Y mutation rate in our CG data by using inferences of the coalescent times of two Chr Y haplogroups, Q1 and Q2b, from ancient DNA data. We used Chr Y data of the 12.6-ky-old Anzick (Q1b) and 4-ky-old Saqqaq (Q2b) specimens ( Rasmussen et al. 2010, 2014). In both cases, we used only transversion polymorphisms and the approach described in Rasmussen et al. (2014). For the calculations of Chr Y haplogroup coalescent times and BSP analyses, we combined the two ancient DNA-based mutation rate estimates using weights proportional to the product of age and coverage of both ancient DNA samples, yielding the final estimate of 0.74 × 10⁻⁹ (95% CI 0.63-0.95 × 10⁻⁹) per bp per yr (Supplemental Information 3). The coalescent ages of Chr Y haplogroups were estimated using two methodologies: Bayesian inference applied on sequence data (SI4) and using short tandem repeat (STR) data. The STR base age estimates were drawn using the method developed by Zhivotovsky et al. (2004) and modified by Sengupta et al. (2006) (Supplemental Information 3).
Phylogenetic analyses
Summary statistics, such as nucleotide diversity, mean pairwise differences, and AMOVA, were computed in Arlequin v3.5.1.3 ( Excoffier and Lischer 2010). We used software package BEAST v1.8.0 ( Drummond et al. 2012) to reconstruct phylogenetic trees, estimate coalescent ages of haplogroups, and sex-specific effective population sizes. The general time reversible (GTR) substitution model was selected by jModelTest ( Darriba et al. 2012) as the best fit for the Chr Y data and the HKY + I + G for the mitochondrial genomes. In order to reduce the computational load, the Chr Y BEAST analysis only contained the variable positions. However, the BEAST input XML file was modified by adding a parameter under the "patterns" section that specifies the nucleotide composition at invariable sites. For the eight geographically explicit regions (Supplemental Table S1), we generated BSPs for both Chr Y and mtDNA data (Supplemental Fig. S4A). The BSPs for Chr Y and mtDNA were plotted together in R ( R Core Team 2012) using the package ggplot2 ( Wickham 2009). To test for significant deviations in diversification rates along the branches of the Y chromosome tree, we used SymmeTree 1.1 (Supplemental Information 4; Chan and Moore 2005).
Simulations
FastSimCoal2 simulations of 500,000 sites of Chr Y and 16,569 sites of mtDNA were performed using mutation rates specified in SI3 and starting population size 10,000. Coalescent times of all nodes in the resulting trees were estimated under a constant size and exponential growth models. The growth model assumed constant size until 400 generations, followed by exponential growth ( Keinan and Clark 2012). For each model, we plotted the histogram of coalescent times of all the nodes of the simulated trees by six different deme formation scenarios: 1: no deme structure; 2: formation of 10 demes 400 generations ago; 3-6: formation of 25, 50, 75, and 100 demes 400 generations ago, respectively (Supplemental Information 5).
Nomenclature
In labeling Chr Y haplogroups, we follow the principles and rules set out by The Y Chromosome Consortium (2002). We try to both incorporate our new information and to maintain the integrity and historical coherence of the initial YCC haplogroup nomenclature as introduced in 2002 and its updates ( Jobling and Tyler-Smith 2003; Karafet et al. 2008). We use an approach similar to the concise reference phylogeny proposed by van Oven et al. (2014) with minor modifications that are aimed at making the Chr Y haplogroup nomenclature more amenable to the incorporation of novel haplotypes than it is now. We propose to simplify the Chr Y haplogroup nomenclature by defining a limited number of levels of alphanumeric depth to be used in the haplogroup names, using the apostrophe symbol (') to denote the "joined" names of related haplogroups at depths greater than Level I (Supplemental Table S5; Supplemental Information 6).
Data access
The raw read data on the Y chromosomes extracted from the whole genome sequences from this study have been submitted to the European Nucleotide Archive (ENA; ebi.ac.uk) under accession number PRJEB8108. The data are also available at the data repository of the Estonian Biocentre ( ebc.ee).
Supplementary Material
Supplemental Material:
Acknowledgments
We thank A. Raidvee for discussions on population size modeling, and T. Reisberg and J. Parik from the Core Facility of the EBC for technical assistance. The sequencing was supported by Estonian and European Research (infrastructure) Roadmap grant no. 3.2.0304.11-0312. M.K., L.S., M.J., S.R., A.-M.I., E.Me., H.S., B.Y., G.H., E.-L.L., G.C., K.T., S.L., A.K., D.M.B., M.Me., R.V., and T.K. were supported by the EU European Regional Development Fund through the Centre of Excellence in Genomics to the Estonian Biocentre and Estonian Institutional Research grant IUT24-1. M.Me. was additionally supported by Estonian Science Foundation grant 8973. M.K. and G.C. were additionally supported by Estonian Research Council grant PUT766. G.H. was supported by a NEFREX grant funded by the European Union (People Marie Curie Actions, International Research Staff Exchange Scheme, call FP7-PEOPLE-2012-IRSES-number 318979). B.Y. was additionally supported by Russian Federation President Grant for young scientists MK-2845.2014.4. T.K. was supported by ERC Starting Investigator grant FP7-261213. M.R. was supported by the EU ERDF through Estonian Centre of Excellence in Genomics grant 3.2.0101.08-0011 and the Estonian Ministry of Education and Research through grant SF0180026s09. T.P. was supported by the Centre of Translational Genomics of the University of Tartu SP1GVARENG. U.G.T. was supported by the Estonian Ministry of Education and Research through grant SF0180026s09. E.K.K. was supported by The Russian Foundation for Basic Research 14-04-00725-a, The Russian Humanitarian Scientific Foundation 13-11-02014, and the Program of the Basic Research of the RAS Presidium "Biological diversity." B.M. was supported by Presidium of Russian Academy of Sciences grant number 12-I-P30-12. O.B. was supported by Russian Science Foundation grant 14-14-00827. Y.X., Q.A., and C.T.-S. were supported by Wellcome Trust grant 098051. A.B.M. was supported by a Leverhulme Program Grant (RP2011-R-045). The work of F.A. was performed according to the Russian Government Program of Competitive Growth of Kazan Federal University and funded by the subsidy allocated to Kazan Federal University for the state assignment in the sphere of scientific activities. Computational analyses were carried out at the High Performance Computing Center, University of Tartu and the Core Computing Unit of the Estonian Biocentre.
Author contributions
M.K., L.S., M.V., M.A.W.S., M.Me., R.V., and T.K. contributed equally to this work. For detailed information on author contributions, please see Supplemental Information 1.